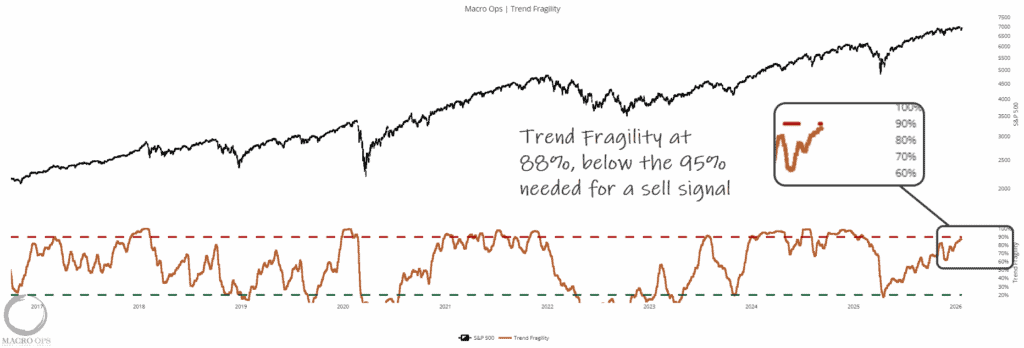
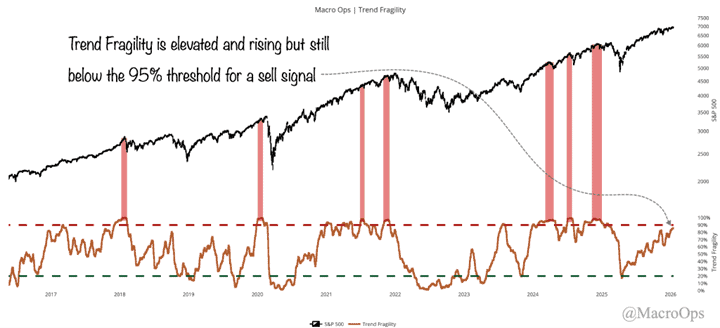
Summary: The primary trend in equities remains up, but the BofA Bull/Bear Dec sell signal is still in effect, and our Trend Fragility indicator is getting closer to triggering its own sell signal. Our base case is that we run higher over the next few weeks before a February selloff, which resets sentiment/positioning. Look for LQD/IEF and BTC as risk-on/off measures. Bigger picture, growth is rebounding and inflation is set to fall in the first half of the year, setting up a goldilocks environment for risk assets.
***The MO port finished 2025 up +45%. The doors are open to our Collective for the next week, so if you’d like to join our group and tackle markets with us this year (which, by all indications, 26’ is looking like it’s going to be a wild ride) then click the link below and get after it***
Join The Collective
1. We’ll be putting out our 2026 non-outlook later this week. It’s a non-outlook because we at MO don’t make predictions; we assess probabilities. To properly assess where we are now, it sometimes helps to pull back and take the 30,000-foot view. So let’s do that today.
Household allocation to equities as a percentage of financial assets is at an all-time high (blue line). Historically, this is bad juju for the subsequent rolling 10-year returns (orange line) (NDR chart via CMG).
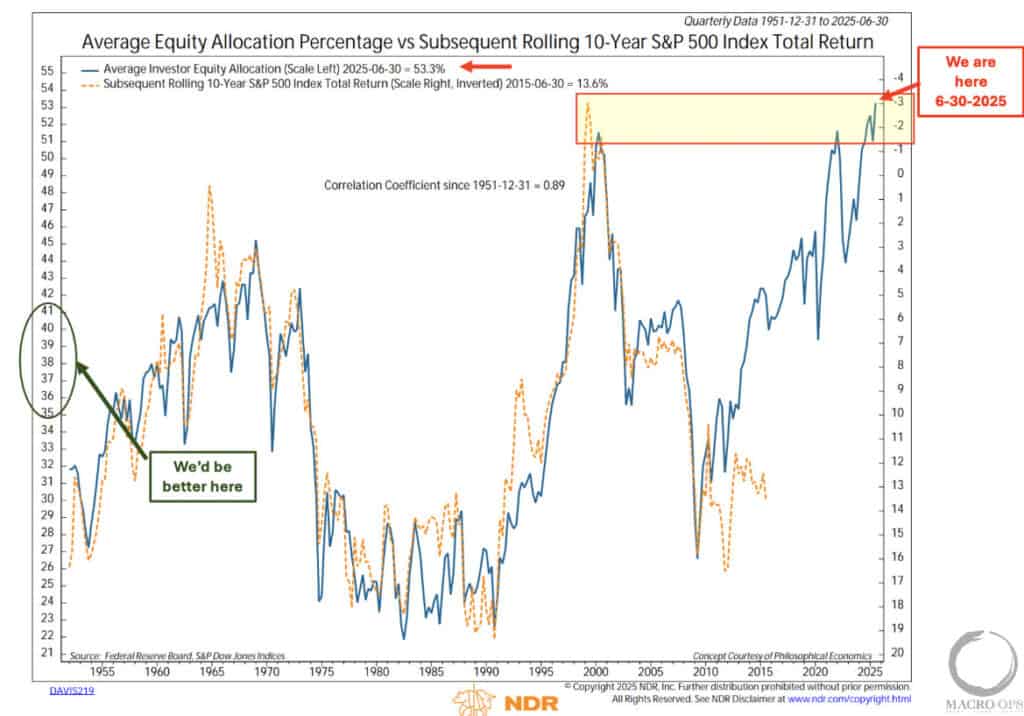
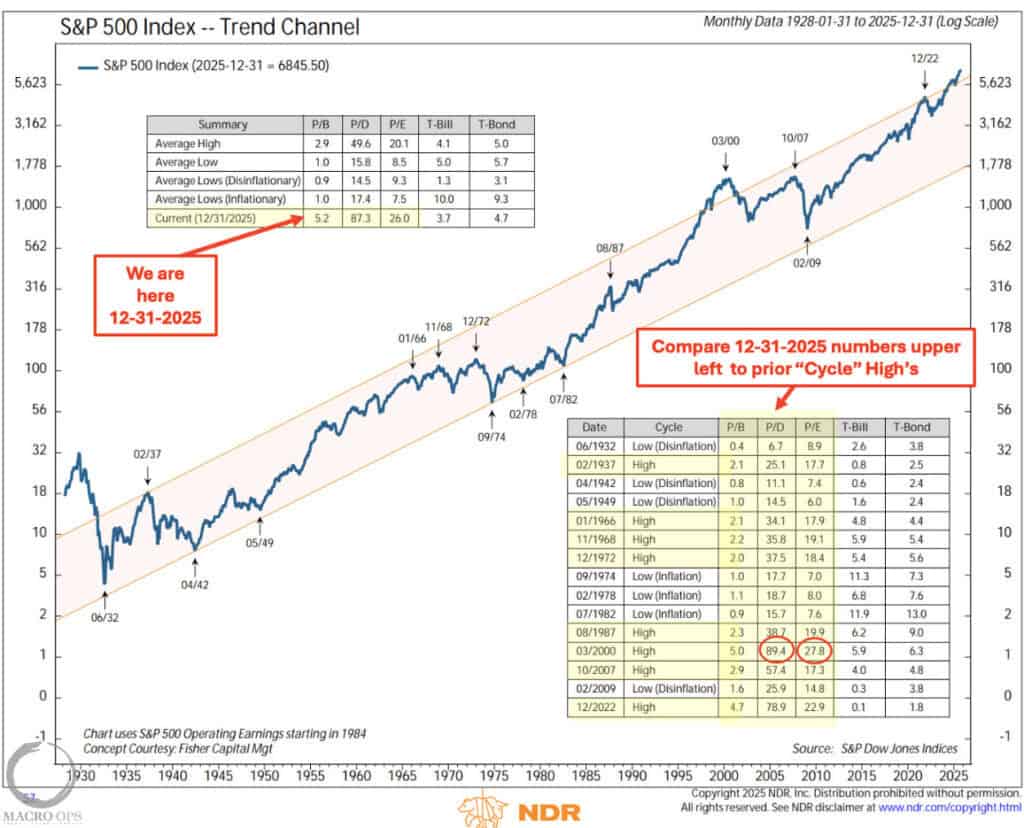
2. Record-high equity holdings go hand in hand with record-high valuations. Neither are timing tools, as each condition can persist for some time. But over a sufficiently long time horizon, valuations are the predominant driver of returns. As we head into 2026, both of these will increasingly become headwinds (NDR chart via CMG).
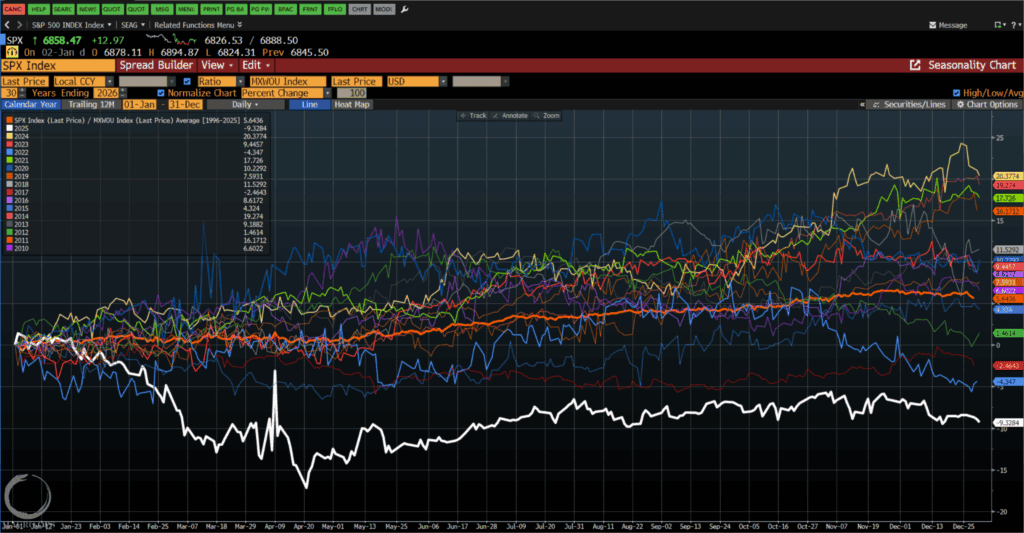
3. In 2025, the SPX saw its worst performance relative to the MSCI World ex-US index in over 15 years (white line). Was this a change in cyclical leadership or a temporary wobble? We’ll have to see if this trend persists, as it’ll have significant implications for the dollar and commodities, if so.
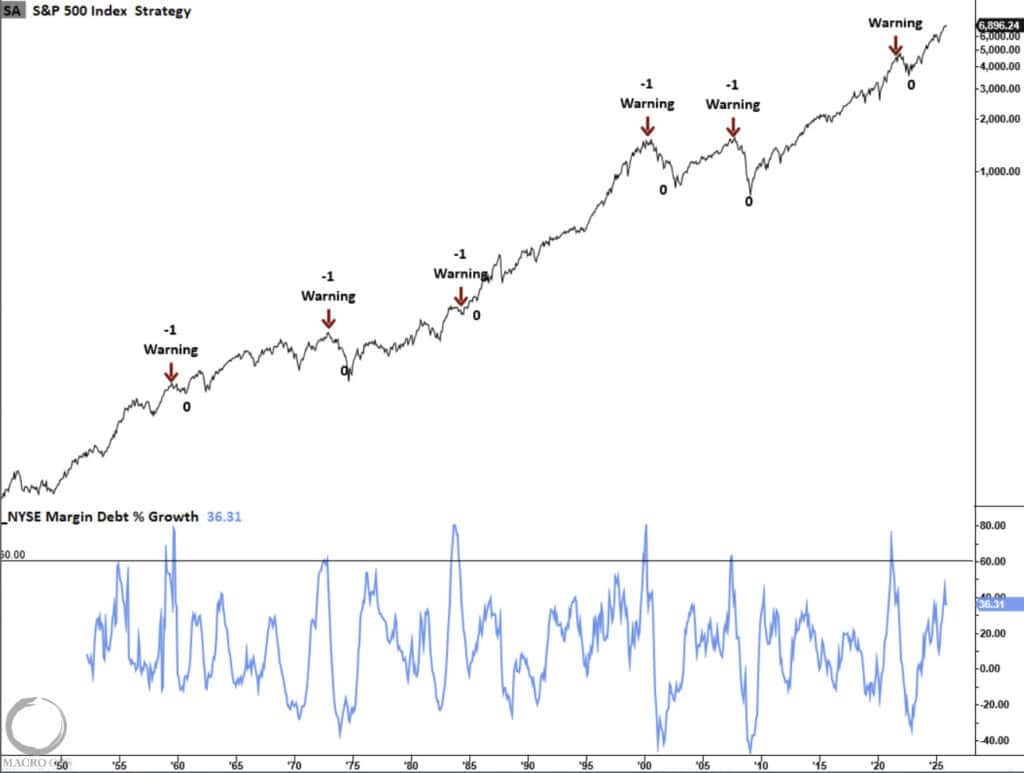
4. One of the key Risk Cycle indicators we track is the RoC in NYSE FINRA Margin Debt. Cyclical bear markets occur when investors get out over their skis, as built-up leverage is required to induce the forced selling which undergirds a grinding bear market. A conditional risk signal triggers when margin debt rises above 60% on a YoY basis. We’re currently at 37%, which is elevated but still well below the threshold (chart via our friend Dean over at TPMR).
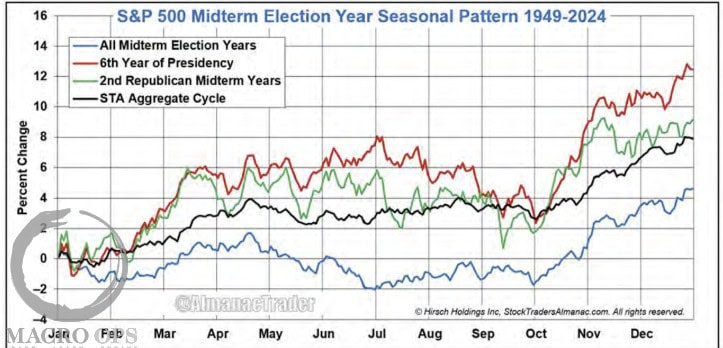
5. Stock Traders Almanac’s seasonality-informed base case for 2026: “70% Probability — Some volatility, most likely in Q3 of 2026. Late 2026 rally in Q4 ultimately pushes the market to a historical sixth year of presidential administrations gains for the year of around 8-12%. Inflation concerns linger but do not grow, the administration’s numerous policy changes deliver mixed yet positive results, new Fed chairman has a seamless transition, and the labor market remains reasonably stable while the AI-fueled spending and development “Super Boom” continues.”
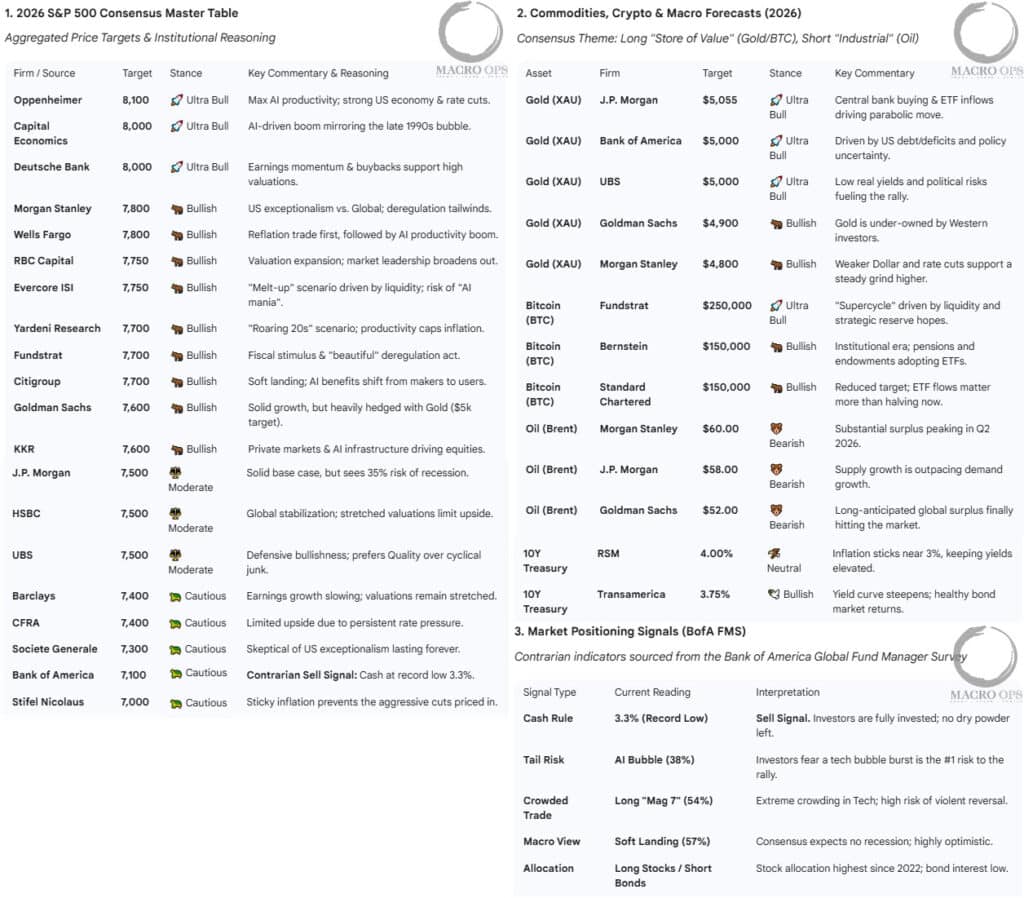
6. Here’s the 2026 market outlook and price targets for SPX, gold, oil, and BTCUSD. Some thoughts… All the shops are bullish equities (though most are projecting pretty modest gains). There’s a stubborn bullish consensus on BTC despite its poor performance in 25’. And oil is still getting no love.
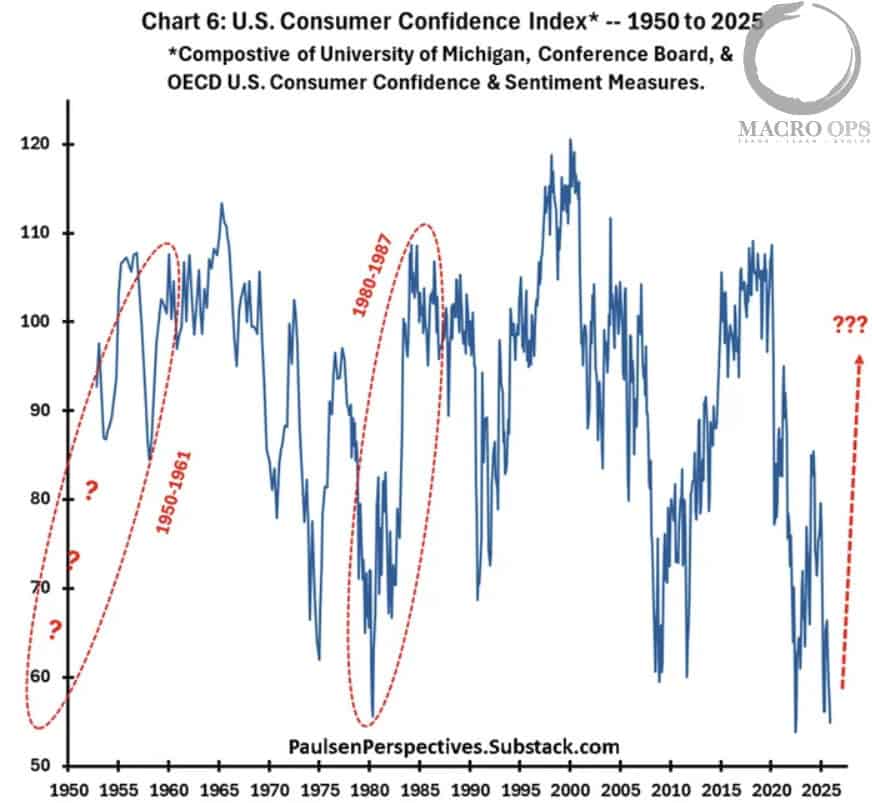
7. Jim Paulsen made the argument in a recent post (link here) that consumer confidence is as critical to stock market success as earnings, despite receiving far less attention. He highlights the current massive divergence between the two and draws parallels to the 1950s and 1980s, when stocks soared primarily on rising optimism. Consequently, Jim views a rebound in Main Street confidence as the likely “winning ticket” for 2026, positioning the S&P 500 for solid returns even if earnings growth remains flat.
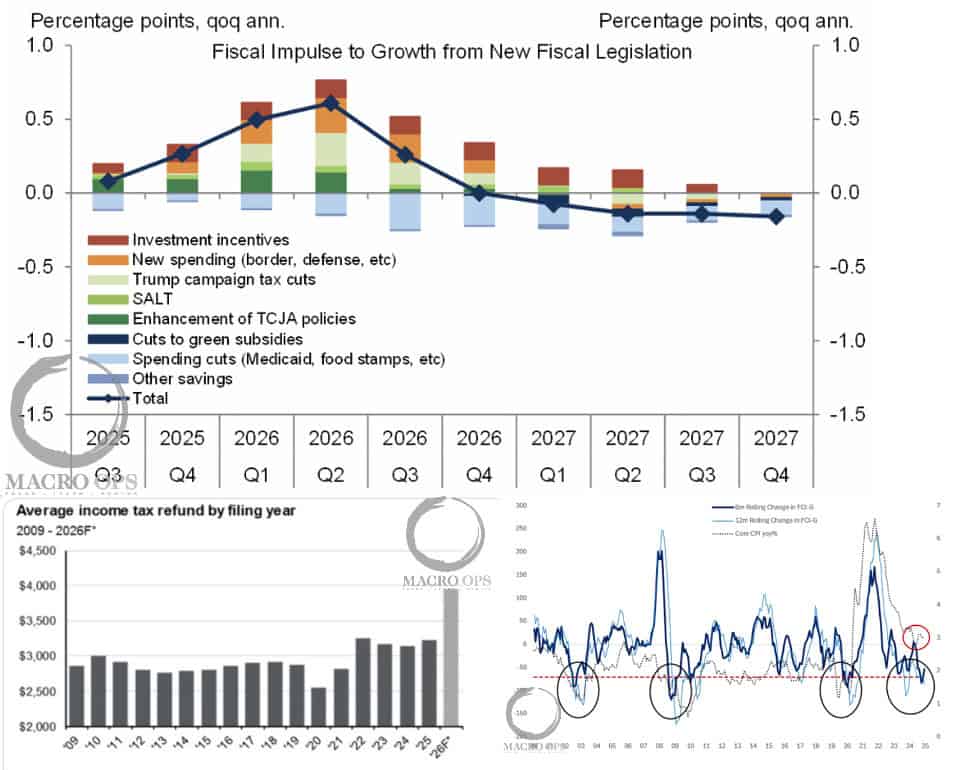
8. Summary of the fiscal and liquidity outlook from Citadel:
- Policy Inflection Point: The start of 2026 marks a key shift in policy, with fading tariff uncertainty and a reversal in fiscal impulse from a Q4 2025 drag (-0.6% of GDP) to an early 2026 tailwind (+0.5% to +0.9% of GDP) driven by the “One, Big, Beautiful Bill Act.”
- Front-Loaded Fiscal Stimulus: Retroactive personal income tax cuts expected to deliver ~$80 billion in Q1 2026 refunds to U.S. households, with a high economic multiplier potentially boosting retail equity trading activity.
- Monetary Policy Support: Lagged effects from 175 basis points of Fed rate cuts over the past 18 months will ease financial conditions, adding an estimated +0.5% to quarterly annualized GDP growth through much of 2026.
- Upside Risks to Stimulus: Policy risks lean toward more support, including additional tariff relief or targeted transfers (e.g., $2,000 payments to households earning under $75k, equating to ~$150 billion in extra fiscal aid), which could further amplify aggregate demand.
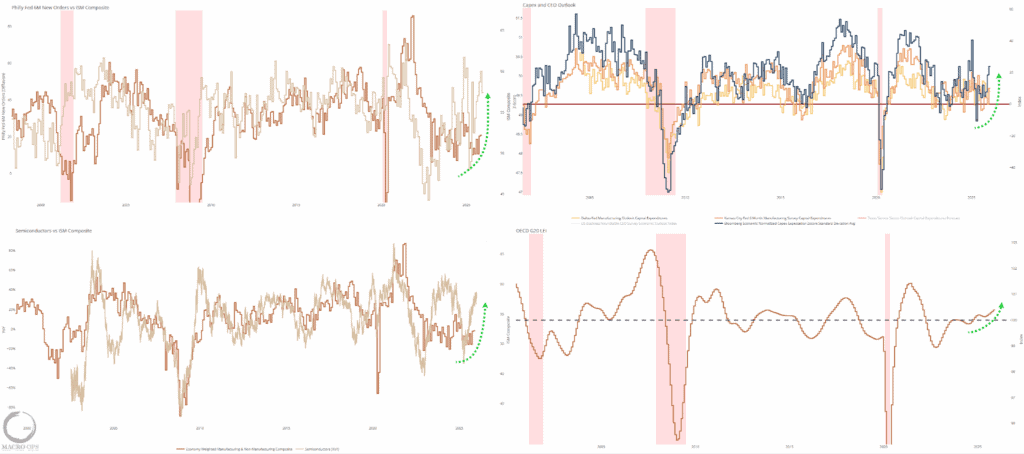
9. We’ve been making the case for rebounding global growth, particularly here in the US, since early Fall. This view took a brief hit following the temporary renewal of US-China Trade tensions in Oct/Nov, but has once again started playing out. Below you can find a number of our growth leads, each of which is inflecting higher.
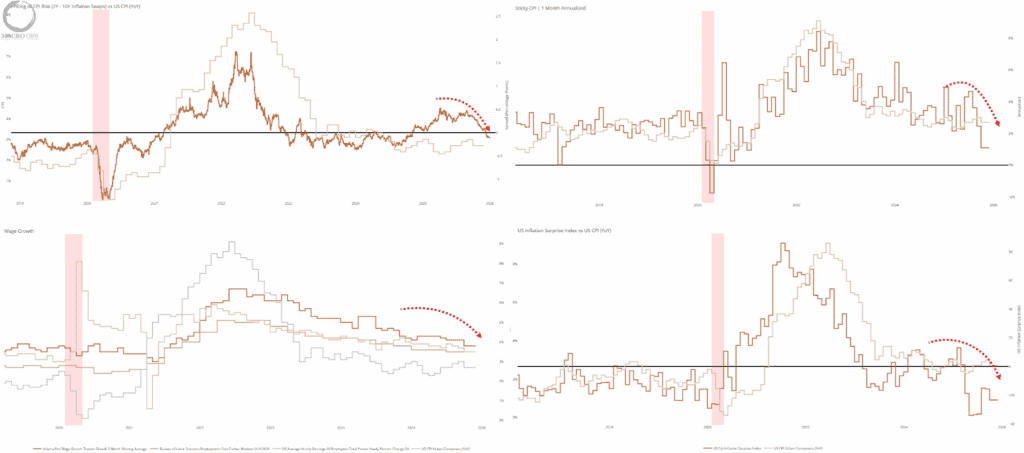
10. Will we see a disinflationary boom in 2026? It certainly looks probable… All our inflation leads continue to fall, with some outright collapsing, and all signs point to this continuing in the first half of 26. Accelerating AI adoption is lowering unit labor costs, allowing companies to protect margins without raising prices on consumers. Additionally, due to CPI’s 12m+ lag to shelter (core CPI’s most significant component), inflation must mechanically fall in the first half of this year.
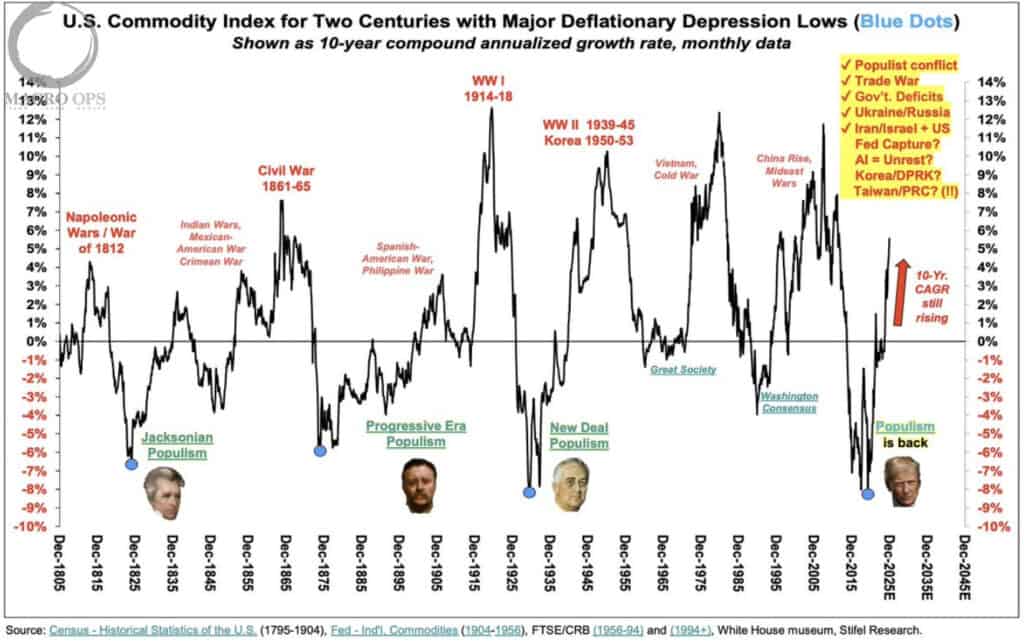
11. This great chart from Stifel Research shows the 10-year annualized growth rate for the commodities index and how major deflationary lows drive the election of populist politicians, which then leads to wars, which drive the tops in commodity super cycles. This is an interesting view of the Narrative Pendulum in action.
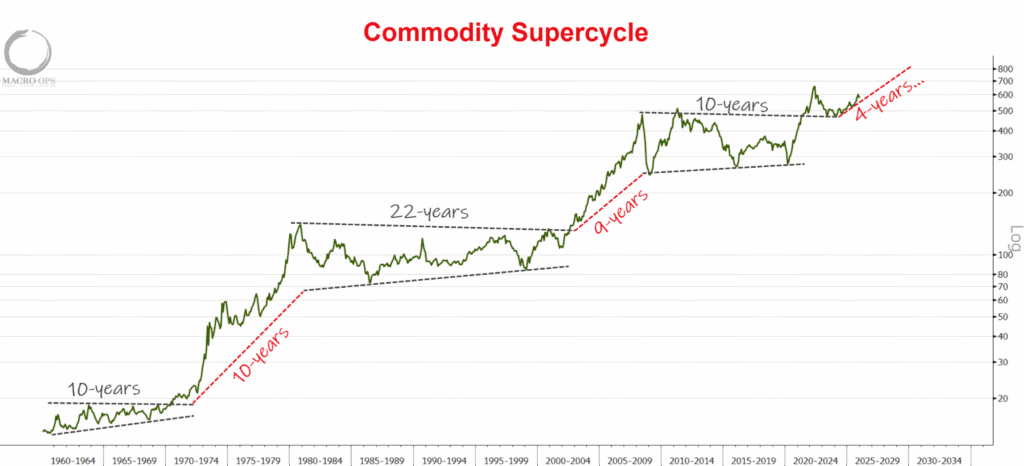
12. This inspired me to update this chart I shared back in early 2022. On a short-term basis, positioning and sentiment have become quite stretched in certain commodities (gold, copper, etc), and we’ll likely see a shakeout sometime in the first quarter of 2026. But… as these two charts show, this commodity supercycle still has a long way to go.
Join The Collective
Thanks for reading.